


To help developers better understand concepts related to audio and videos and easily build audio and video apps, ZEGOCLOUD has developed this Advanced Audio and Video Development course with the help of its internal experts.
This course includes a series of lessons. We will start with the basic concepts related to audio and gradually expand the content. In future lessons, we will guide you through the steps of developing audio and video apps using ZEGOCLOUD’s SDKs and answer all sorts of questions that might arise during the process.
Future lessons will be available soon. Stay tuned!
Preface
We are familiar with sounds because we are surrounded by sounds every day. Sound is one of the most basic information carriers. We use sound for socializing, communication, entertainment, human-machine interaction, and smart control. In our lives, sound is perceived and used everywhere. In various app stores, countless apps today use sound as their main feature for all kinds of scenarios, such as voice dating, voice chat for gaming, voice reader, board games, and real-time singing.
In early 2022, Clubhouse, an app focusing on voice chat, took the world by storm and was once valued at over one billion U.S. dollars. The price of “sound concept stock” rose sharply in the stock market. Clubhouse was probably only a fad. Its fate was determined by myriad factors such as operation strategies and content ecosystem. Nevertheless, it still gave us a glimpse into the charm of sound. In the future, more technological explorations around sounds will surely appear.
However, the features may change, and whatever innovations there will be, one rule will always apply: to create a successful audio product, you must master the use of audio technologies. To use technologies well, fundamental concepts do matter. In this lesson, we will talk about some fundamental concepts of audio technologies to help new beginners understand.
In this lesson, we will first introduce the basic features of sound, called the three elements of sound. Then, we will see how sound is captured and quantized and understand how natural sound is converted to analog signals and then to digital signals. Finally, we will learn about key quality metrics of digital audio signals.
Three elements of sound: pitch, loudness, and timbre
Although we are very familiar with sounds, if you are to describe a sound, from which aspects would you start? When we describe a person, we use attributes like gender, appearance, height, and weight. When we describe sounds, we often use adjectives like piercing, deep, loud, or weak. We may directly indicate the kind of a sound, such as the sound of wind, rain, or a person. However, these attributes can only be perceived. They seem hard to define, let alone quantize. It would be helpful if we could define the attributes indicated by these adjectives and nouns. For this purpose, we need to understand three basic and important attributes of sound: pitch, loudness, and timbre, also called the three elements of sound.
1 Pitch
When we describe sound as “piercing” or “deep”, we’re talking about our perception of an attribute called pitch. In physics, a sound is defined as a wave generated by the vibration of an object, such as our vocal cord. Pitch is determined by the vibration frequency. The higher the frequency, that is, the faster the object vibrates, the higher the pitch, and the more “piercing” the sound. Conversely, the lower the pitch, the deeper the sound. The vibrations of our vocal cord fall approximately in the frequency range between 100 Hz and 10 kHz, which roughly corresponds to the range from deep male voice to high female voice. Our ears can perceive sounds with a frequency between 20 Hz and 20 kHz. Sound wave with a frequency that falls below this range is called infrasound, and that above this range is called ultrasound. Infrasound and ultrasound cannot be perceived by the human ear. We can see that, although the audible range of the human ear is limited, it still covers the range of vocal cord vibrations. This means that the human ear can capture any sound made by any person.

Figure 1
2 Loudness
When we speak of a sound as “loud” or “weak”, we are describing our perception of its loudness. Loudness is determined by the amplitude of vibration. When the distance traveled by sound is the same, the higher the amplitude, the louder the sound. When the amplitude is fixed, as the distance increases, the loudness of sound decreases. This is the reason why we can’t hear a sound when it’s too far away.
3 Timbre
When we speak of “the sound of wind, of rain, or of reading books”, we’re describing an overall impression of sounds with different pitch and loudness, which is called timbre. Timbre is a type of “sensory attribute”. We can use timbre to distinguish the sounding object, identify its state, and evaluate the sound quality. For example, we can identify someone from their voice, judge the sound made by a piano or erhu, or describe a sound as beautiful or pleasant based on the timbre. So, how is timbre produced? What determines the timbre of a sound? We have learned that sound is the wave produced by a vibrating object. In fact, the vibration of the whole object generates only the fundamental tone. Each part of the object can also vibrate to generate overtones. The different combinations of the fundamental tone and overtones produce different timbres. In general, we think that timbre is determined by the material of the sounding object.
The table below compares the three elements:
| Pitch | Loudness | Timbre | |
| Definition | Feelings of how high or low a sound is to the human ear | Feelings of how intense a sound is to the human ear | The overall reaction of the human ear to sounds with different pitch and loudness (can be used to distinguish the source of sound) |
| Determined By | Frequency of sound wave | Amplitude of sound wave | Material of the sounding object |
| Descriptions | Deep, piercing, sharp | Weak, loud, deafening | Sound of wind, rain, or reading |
Figure 2
Now, let’s take a look at an example of sound wave. The following waveform graph shows the vibration of an object over a period of time.
The horizontal axis is the time axis. We call the interval between two successive crests or troughs a vibration period. (The reciprocal of a period is the vibration frequency.) The vertical axis is the amplitude axis. The amplitude of vibration is half the distance between the Y-coordinates of a crest and a trough. Now, we can divide the following wave into three parts marked in blue, red, and black, respectively.
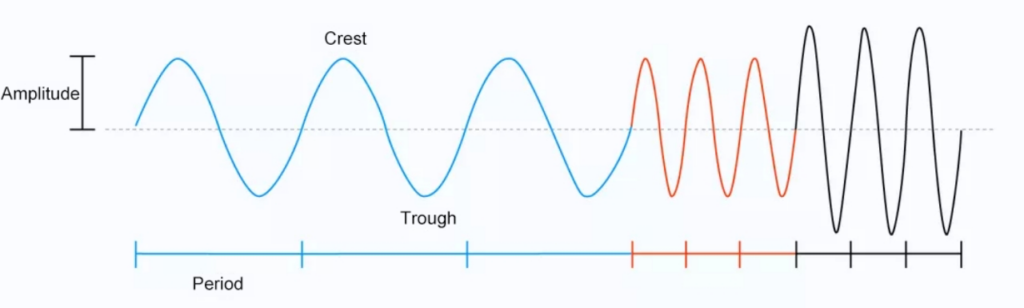
Figure 3
Let’s look at the wave from left to right. For the blue and red parts, the crest and through are of the same height, but the red part is denser on the time axis. So, we say that the blue part and the red part have the same amplitude, but the red part has a higher frequency (smaller period).
The red and black parts have the same density on the time axis, but the distance between crest and trough (Y-coordinates) of the black part is larger. So, we say that the red part and black part have the same frequency (same period), but the black part has a larger amplitude.
According to what we have learned about the three elements of sound, we can say that: The blue and red parts are equally loud, but the red part is higher in pitch. The red and black parts have the same pitch, but the black part is louder. Since we did not consider the influence of overtones, we will not make judgment on timbre here.
Capturing and Quantization of Sound
Now that we have learned about the three dimensions in which we can describe and distinguish sound, it’s time to move on to practical application. Our purpose is to develop apps based on sounds. To do so, we must first capture and store sounds. Sounds travel in the form of waves in mediums like air, solids, and liquids. How can we capture sounds and convert them into data for transmission between electronic devices and over networks?
1 Sound Capturing
The most common sound capturing method is using devices such as a microphone. The phone we use every day has several microphones, such as the one at the bottom for phone calls, the one at the top for video calls, and the one at the back to facilitate recording. These devices have a thin and sensitive diaphragm inside, which is a bit like our eardrum. Sound waves with different amplitudes and frequencies cause the diaphragm to vibrate along with them. With the help of other modules, these vibrations are turned into varying currents. In this way, the vibration patterns of a sound wave are recorded as continuous electronic analog signals. We have thus succeeded in recording the key features of the sound, which means that we have “captured” the sound.
How do ZEGOCLOUD’s SDKs capture sound?
ZEGOCLOUD’s SDKs use the APIs provided by different operating systems, such as CoreAudio on Windows, AudioRecord and OpenSLES on Android, and AudioUnit on iOS, as well as default audio capture devices to capture sounds.
If multiple capturing devices are available, the SDKs provide APIs that allow developers to select and configure devices based on their needs. The SDKs take care of everything, including calling the API, communicating with devices, and obtaining and processing data. Developers do not need to worry about underlying details. Instead, they can dedicate their time to the implementation of business requirements. Of course, ZEGOCLOUD’s SDKs also allow developers to customize the audio capturing module by configuring sound sources, capturing parameters, and the pre-processing procedure. The SDKs provide APIs that developers can simply call to transmit the audio data.
2 Digitalization of Audio Signals
We have mentioned how sound can be captured by devices like microphones and turned into analog electronic signals. “Analog” means continuous in both frequency and amplitude. So, analog signals can be divided into an infinite number of points. Does this sound a bit complicated or hard to handle? Well, you’re not alone. Computers “feel” the same. Although we often regard computers as “intelligent devices”, computers are actually a bit “simple”, in the sense that they only recognize digital signals of 0 and 1. (Unlike analog signals, digital signals are discrete, finite, and enumerable.)
So, to accommodate to computers, we need to “translate” the analog signals captured by devices to discrete digital signals. In other words, we need to convert analog audio signals into digital audio signals. This procedure is called digitalization of analog signal or analog-to-digital conversion (A/D conversion). It includes steps of sampling, quantization, and encoding. Let’s see how it’s done.
As shown in Figure 4, the red wave represents an analog signal. Assume that the time duration is one second. The X-axis represents time, and the Y-axis indicates amplitude. Let’s convert this analog signal into a digital signal step by step.
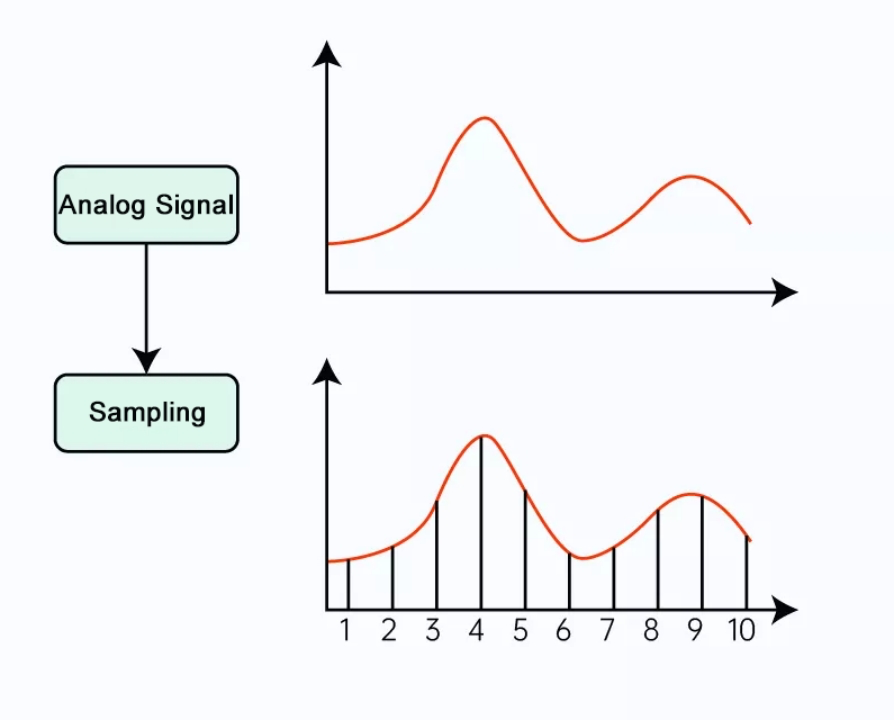
Figure 4
Step 1 – sampling: digitalize the analog signal along the time axis at a certain sampling rate.
First, we take 10 points along the time axis at a fixed interval of T (0.1s), as shown in the figure. T is called the sampling period. The reciprocal of sampling period is called sampling rate (f), which is the number of samples taken per second. The unit of f is Hz. In this example, f = 1/T = 10 Hz. It’s easy to see that the higher the sampling rate, the more samples we get per unit time, and the better the original waveform is restored. If we take an infinite number of points at a very small interval, the original waveform can be completely reproduced.
Step 2 – quantization: digitalize the analog signal at a certain precision along the amplitude axis.
After sampling, the next step of A/D conversion is quantization. In the sampling step, we digitalized the signal along the time axis. Now, it’s time to do something similar along the amplitude axis.
As shown in Figure 5, assume that the value range of the Y-axis is from 0 to 8. Then, we obtain the ordinate (rounded up to the nearest integer) of each sampling point. These values are the quantized amplitudes. Since we divided the Y-axis into 8 parts, a total of 8 values can be used to represent our signal. The quantization precision is thus 8. The more parts we have, the smaller errors caused by rounding, which means that the quantized amplitude is more accurate to better reproduce the original waveform. A term called bit depth can be used to represent the quantization precision. We will get back to it later.

Figure 5
Step 3 – encoding: record the sampled and quantized data using a specific format.
After quantization, we obtained the amplitude value of each sampling point. Now we come to the last step of A/D conversion: encoding. Encoding converts the amplitude values to a series of binary values, which the computer can understand.
As shown in Figure 6, the sample numbers indicate the order of samples. The sample values in decimal express the quantized amplitudes, which are converted into binary values, shown in the next row. We thus obtain a series of values that contain digits “0” and “1” only, which form the discrete digital signal. Here, this signal is composed of raw data without any compression, which is also called pulse code modulation (PCM) data. In actual practice, we usually apply other encoding algorithms to compress the PCM data. We will talk about that in future lessons.
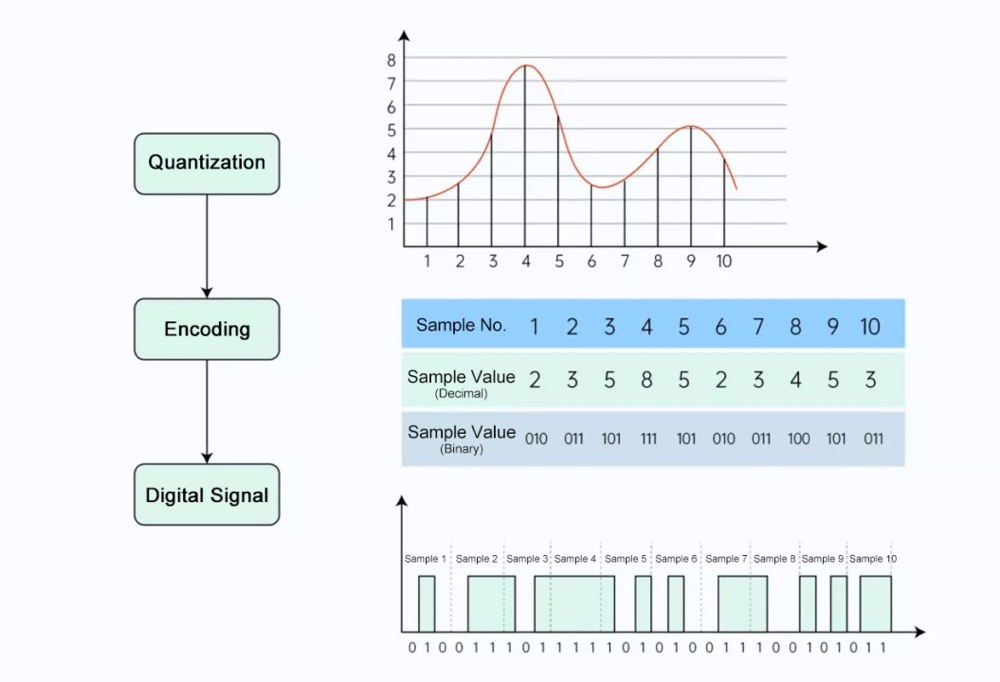
Figure 6
Now, we have covered the whole procedure of digitalizing analog audio signals. During sampling, quantization, and encoding, the analog signal is digitalized along the time axis and the amplitude axis. In the end, we obtained the audio signal in binary. We have made a great step forward. The computer can now understand and process our audio signal.
Sound has three elements. Likewise, digital audio signal also has some basic attributes that deserve our attention, including sampling rate, bit depth, and the number of channels. These attributes are vital in determining the quality of digital audio signals (or sound quality). They are called the three factors of digital audio signal quality. We have already mentioned these attributes while talking about digitalization. Let’s now study them in detail.
Three Factors of Digital Audio Signal Quality
1 Sampling Rate
The sampling rate of audio refers to the number of samples taken per unit time (1 second) from the audio signal (see the sampling step in previous sections). For example, the sampling rate of 44.1 kHz means that 44,100 samples are taken per second.
As we already learned, the higher the sampling rate, the more samples we take, and the better the original waveform is reproduced. This is how sampling rate influences sound quality. The Nyquist–Shannon sampling theorem defines that: In order to accurately reproduce an audio signal, the sampling rate (f) must be at least twice the maximum frequency (fmax) of the audio signal, that is, f > 2*fmax. fmax is also called the Nyquist frequency. When the sampling rate is less than 2*fmax, the original signal will not be properly reproduced. For example, to sample an audio signal with the fmax of 8 kHz, the sampling rate f should be at least 16 kHz.
The figure below shows the sampling results of an audio signal with a maximum frequency of f at three different sampling rates (f, 2f, and 4f/3, respectively). We can clearly see that the original features of the signal can be properly retained only when the sampling rate is 2f. The results of sampling at f and 4f/3 significantly deviated from the original waveform.
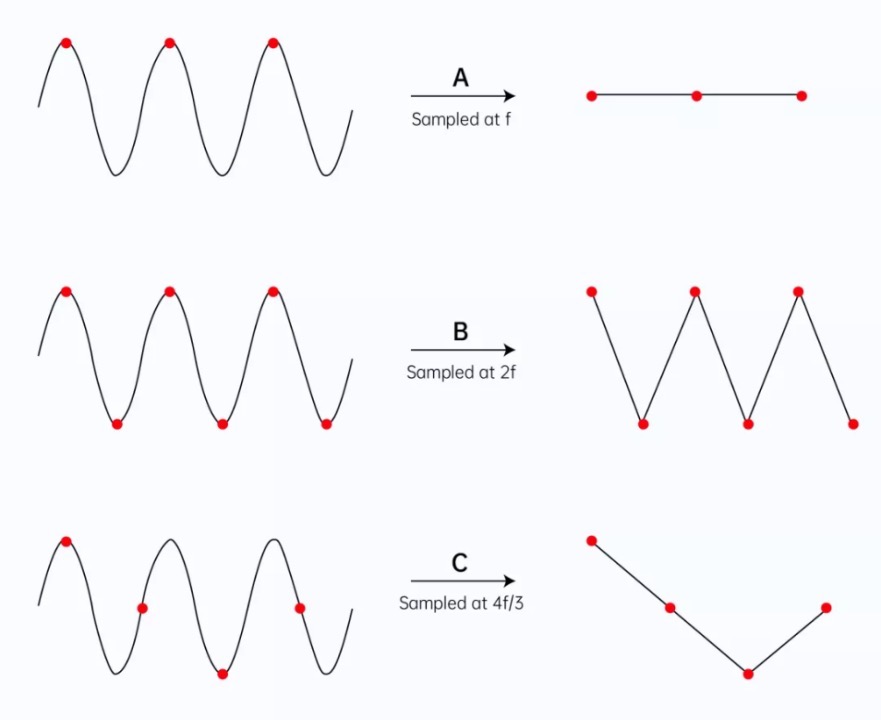
Figure 7
So, how should we choose the sampling rate?
According to the discussion above, it seems that a higher sampling rate means better sampling results. But is this true? Theoretically, the sampling rate must first satisfy the Nyquist–Shannon sampling theorem. When this is satisfied, the higher the sampling rate, the more information about the original audio is retained, which makes the sound more realistic. However, data volume increases when the sampling rate gets higher, and a large data volume poses higher requirements on storage and bandwidth. In actual practice, we need to balance bandwidth consumption with sound quality. Different sampling rates are adopted in different scenarios, which are described in the table below.
| Sampling Rate | Description |
| 8 kHz | This sampling rate can satisfy basic communication needs, such as voice chats and calls. At this sampling rate, data volume is effectively reduced to facilitate transmission and storage in many environments. The frequency of the human voice normally falls in the range from 300 Hz to 700 Hz, which can be from 60 Hz to 2,000 Hz in extreme conditions. Based on the Nyquist–Shannon sampling theorem, a sampling rate of 8 kHz is more than sufficient. |
| 16 kHz or 32 kHz | These sampling rates enhance basic communications with improved sound quality without bringing too much pressure on bandwidth or storage. Some audio processing algorithms require a sampling rate of 32 kHz. |
| 44.1 kHz or 48 kHz | In scenarios like online karaoke or music teaching, where sound quality matters a lot, a higher sampling rate can be adopted. Since the audible range of the human ear is from 20 Hz to 20 kHz, based on the Nyquist–Shannon sampling theorem, a sampling rate higher than 40 kHz is sufficient. In actual practice, a sampling rate of 44.1 kHz can satisfy most audio and video scenarios. 44.1 kHz is generally regarded as the standard sampling rate for the sound quality of CDs. |
| 96 kHz or 192 kHz | These sampling rates are used in special scenarios where the sampled audio requires post-processing or secondary processing. For human ears, such sampling rates do not mean better sound quality. They will put pressure on storage and bandwidth and have high requirements for capturing and playing devices. They are generally not considered in RTC scenarios. |
Figure 8
Which sampling rates do ZEGOCLOUD’s SDKs use?
In real practice, the sampling rates used during capturing, pre-processing, and encoding may be different. The performance of physical devices affects the rate selection. The algorithms used during pre-processing and encoding by software and hardware also impose specific requirements. So, the sampling rate may change. The final sampling rate is the one used during encoding.
To satisfy all sorts of requirements in RTC scenarios, ZEGOCLOUD’s SDKs support many sampling rates ranging from 8 kHz to 48 kHz. The default configuration can best match algorithms of ZEGOCLOUD and provide the best tuning effect. During the processing procedure, the audio engine of ZEGOCLOUD’s SDKs can automatically change the sampling rate. Developers don’t need to worry about it. By default, ZEGOCLOUD’s SDKs adopt the sampling rate of 44.1 kHz for capturing and 44.1 kHz or 48 kHz for encoding (normally 48 kHz for OPUS and 44.1 kHz for AAC). For special requirements, ZEGOCLOUD’s SDKs also provide advanced APIs for developers to configure a lower sampling rate (8 kHz or above). This will be helpful when developers need to consider compatibility with certain customized devices or bandwidth restrictions.
2 Bit depth
We have mentioned the concept of bit depth while talking about quantization during the digitalization of audio signals. Bit depth indicates the precision, usually in bits, of the amplitude at every sampling point in the quantization step.
For example, when the bit depth is 8-bit, the amplitude at every sampling point is represented by 2^8 = 256 bits. When the bit depth is 16-bit, the amplitude at every sampling point is represented by 2^16 = 65,536 bits. Obviously, the bit depth of 16-bit allows more data to be stored and represented. The data is thus more accurate, and the quantization error is smaller. Bit depth influences the level of details preserved in sound. We can regard it as the “resolution” of sound signals. The larger the bit depth, the more realistic and lively the sound.
Bit depth selection
Similar to sampling rate, a larger bit depth is always better in theory. However, bandwidth, storage, and the actual listening experience are also factors to consider. So, we should select different bit depths for different scenarios.
| Bit Depth | Description |
| 8-bit | This bit depth is commonly used in the early stages and can ensure the sound quality required for basic calls. |
| 16-bit | This bit depth is considered the bit depth of professional-level sound quality. It can fully record dynamic changes in most audio scenarios and is applicable to a large range of scenarios. This bit depth is also regarded as the standard bit depth for the sound quality of CDs (same for the sampling rate of 44.1 kHz). |
| 24-bit, 32-bit, or 64-bit | For most users of common audio-playing devices, such as phones and ordinary speakers, the difference between 32-bit and 16-bit is very subtle. The improvement in sound quality is not obvious, whereas much more pressure is put on bandwidth and storage. So, there is no need to ask for a large bit depth. |
Figure 9
ZEGOCLOUD’s SDKs adopt a bit depth of 16-bit for sampling (subject also to device capabilities), which can strike a balance between the sound quality and bandwidth pressure in RTC scenarios.
3 Number of Channels
Compared with sampling rate and bit depth, the sound channel number is probably a more familiar concept to many of us. When we talk about mono and stereo, we’re describing the number of channels of an audio signal (mono for 1 and stereo for 2). Sound waves can be superposed, which can also happen during sound capturing and playing. We can capture sounds from multiple sources. We can also output audio to multiple speakers. In general, the number of channels refers to the number of sources from which sounds are captured or the number of speakers when audio is played.
In addition to 1 channel and 2 channels that are commonly used, various choices like 4, 6, and 8 channels are also supported on PCs. In general, more channels can make us feel more like in the actual scene, so the listening experience is better. For many phone manufacturers, stereo speakers have become the standard choice for their flagship products. To offer a better user experience, more and more apps in RTC scenarios have also started to support two channels.
Selection of the channel number
Most real-time audio and video scenarios only support mono (one channel) or stereo (two channels) due to the limits of codecs and pre-processing algorithms. Stereo is mostly used in scenarios such as radio, live music, instrument course, and ASMR. In most other scenarios, one channel is enough.
Of course, the actual number of channels is determined by the capabilities of capturing and playing devices. For example, when audio data is decoded, the number of channels is obtained. Before playing the audio, device attributes are obtained. If the device only supports stereo, but the data has only one channel, the data is first converted for playing with two channels. Similarly, if the device has only one channel while the data has two, the data is first converted for playing with one channel.
How many channels do ZEGOCLOUD’s SDKs adopt?
ZEGOCLOUD’s SDKs use one channel in sampling and encoding by default but also support two channels as an option for Android, iOS, and Windows. Developers can select the number of channels through our API. Note that the number of channels is not only dependent on the SDKs. If two channels are selected, the devices and systems must also support two channels.
Audio bitrate
As already mentioned, the three factors of digital audio signal affect not only sound quality but also the space and bandwidth required for storage and transmission. In actual practice, sound quality determines user experience, and bandwidth determines costs. These factors need to be considered. Although sound quality is more of a subjective metric, bandwidth and storage space are easy to be quantified. Therefore, we need to know the concept of bitrate.
Bitrate indicates the amount of data contained in unit time (generally 1 second). It can be calculated by using a formula. For example, for a file of PCM audio data with two channels, a sampling rate of 44.1 kHz, and a bit depth of 16-bit, we can use the following formula to calculate the bitrate:
Bitrate = sampling rate * bit depth * number of channels * duration (1s)
The result is: 44.1 * 1,000 * 16 * 2 * 1 = 1,411,200 bps = 1,411.2 Kbps = 1.411 Mbps (Note that kHz is converted to Hz and bps to Mbps. In addition, b indicates bit.)
If the duration of the PCM audio file is 1 minute, the amount of data required to store or transmit this file should be 1.411 Mbps * 60s = 84.66 MB.
Note that this is the bitrate of the uncompressed, raw audio data in the PCM file. In RTC scenarios, we often use codecs like AAC and OPUS to encode and compress the data to further reduce pressure on bandwidth and storage. For more information about encoding, we will elaborate on it in future lessons. When choosing the bitrate, we need to take both the cost and sound quality into consideration.
Summary
All right. In this lesson, we first learned the basic features of sound and the dimensions in which a sound signal can be described. Then, we understood the procedure of capturing and quantizing sound and how natural sounds are captured and then converted to a form that computers can understand. In the end, we learned about the key quality metrics of digital audio signals and how they affect sound quality.
These are essential knowledge that will be used in every step of our journeys of applying audio technologies. If you have any questions or want to learn more, you can refer to related materials or our future lessons.
Let’s Build APP Together
Start building with real-time video, voice & chat SDK for apps today!
