How to get the stack trace information of the ZegoEffects SDK?
2023-05-05
Products / Plugins:AI Effects
Platform / Framework:iOS / Android / macOS / ReactNative
The stack trace information of the ZegoEffects SDK can be obtained by the following methods on each platform.
-
Android
- Real-time analysis of logs
adb logcat | ndk-stack -sym [target abi (armeabi/armeabi-v7a/arm64-v8a) of the so dynamic library]For example:
adb logcat | ndk-stack -sym /path/to/your/project/armeabi-v7a- First get the log and then analyze (use adb logcat to save the log file, and then analyze it through the ndk-stack command)
adb logcat > xx.logndk-stack -sym [target abi of the so dynamic library] -dump [log file]For example:
adb logcat > crash.logndk-stack -sym /path/to/your/project/armeabi-v7a -dump crash.log -
iOS/iPadOS
- Connect the iOS device to the Mac, open Xcode, and select “Window > Devices and Simulators” in the top menu bar.
- Select the specified device on the left, then click “View Device Logs”, in the pop-up dialog, find the log corresponding to the Process application package name and Type is “Crash” at the corresponding time, right-click on this log and select “Export Log”, the saved “.crash” file is the stack trace information.

-
macOS
The files ending with “.crash” in the “~/Library/Logs/DiagnosticReports” path are the stack trace information.
-
Windows
- Find the registry path:
HKEY_LOCAL_MACHINE\SOFTWARE\Microsoft\Windows\WindowsError Reporting\LocalDumps- In the right window, create string values DumpCount, DumpFolder, and DumpType and modify their values, as shown below: The value of DumpType: 0 = Create a custom dump 1 = Mini dump 2 = Full dump
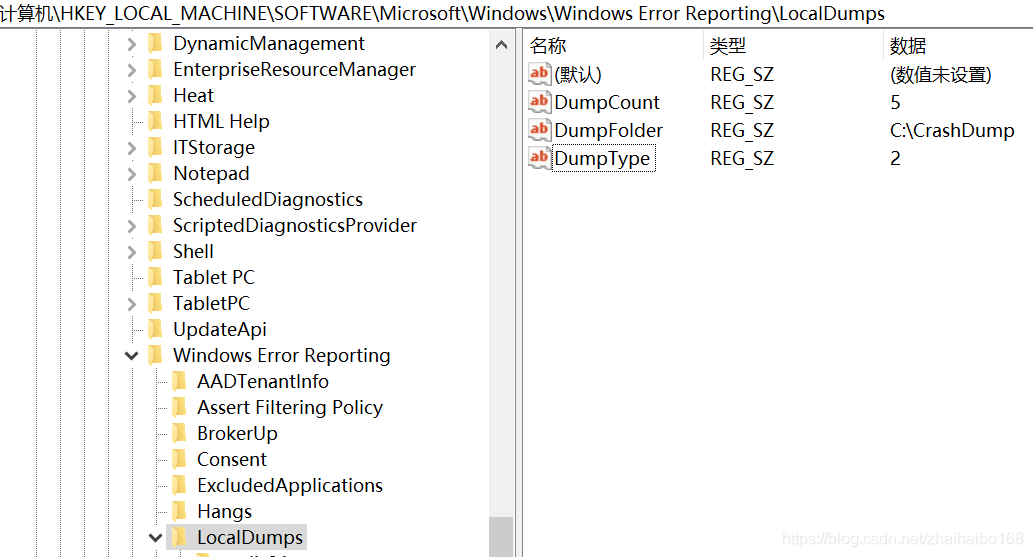
- The system will generate a Dump file for the corresponding program in the DumpFolder directory set above when the program crashes.