提交工单
咨询集成、功能及报价等问题
The User Behavior Monitoring module helps you to trace and analyze the user experience of audio and video in the user lifecycle in the view of user. You can view the room visiting records, stream playing and publishing information, and behavior event information of a user. You can also evaluate the user experience, diagnose and analyze video quality problems, and identify the root causes to solve the problems and improve user experience.
The following table lists two sub-pages of this module and the functions provided on the sub-pages.
| Sub-page | Function |
|---|---|
| Search page |
|
| Details page |
|
Search by user ID
)
Search by room ID
)
View room visiting records of a user.
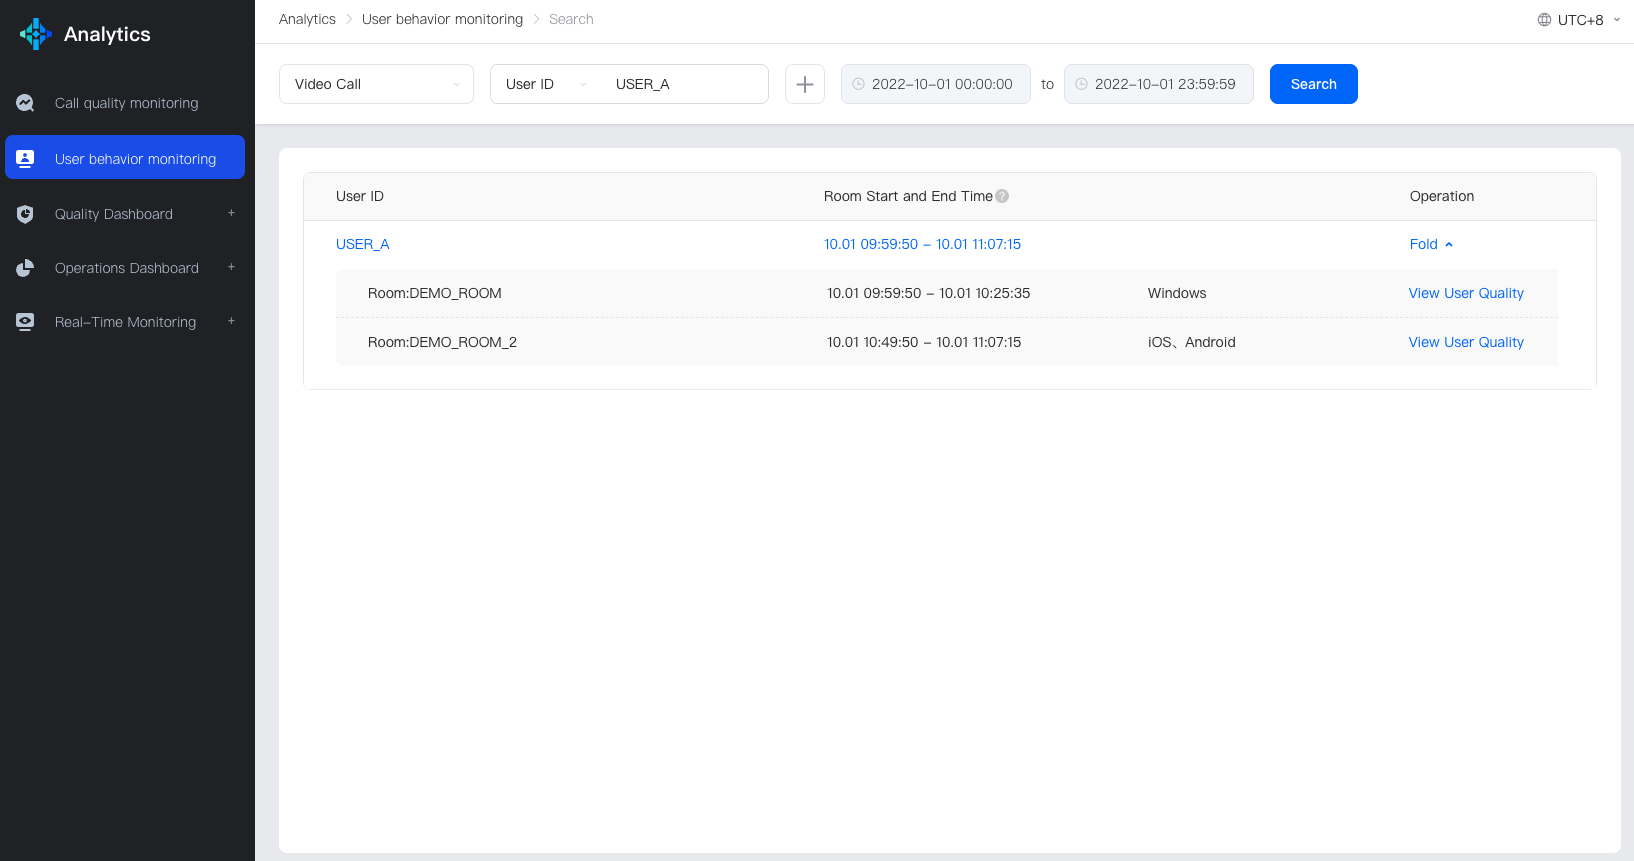
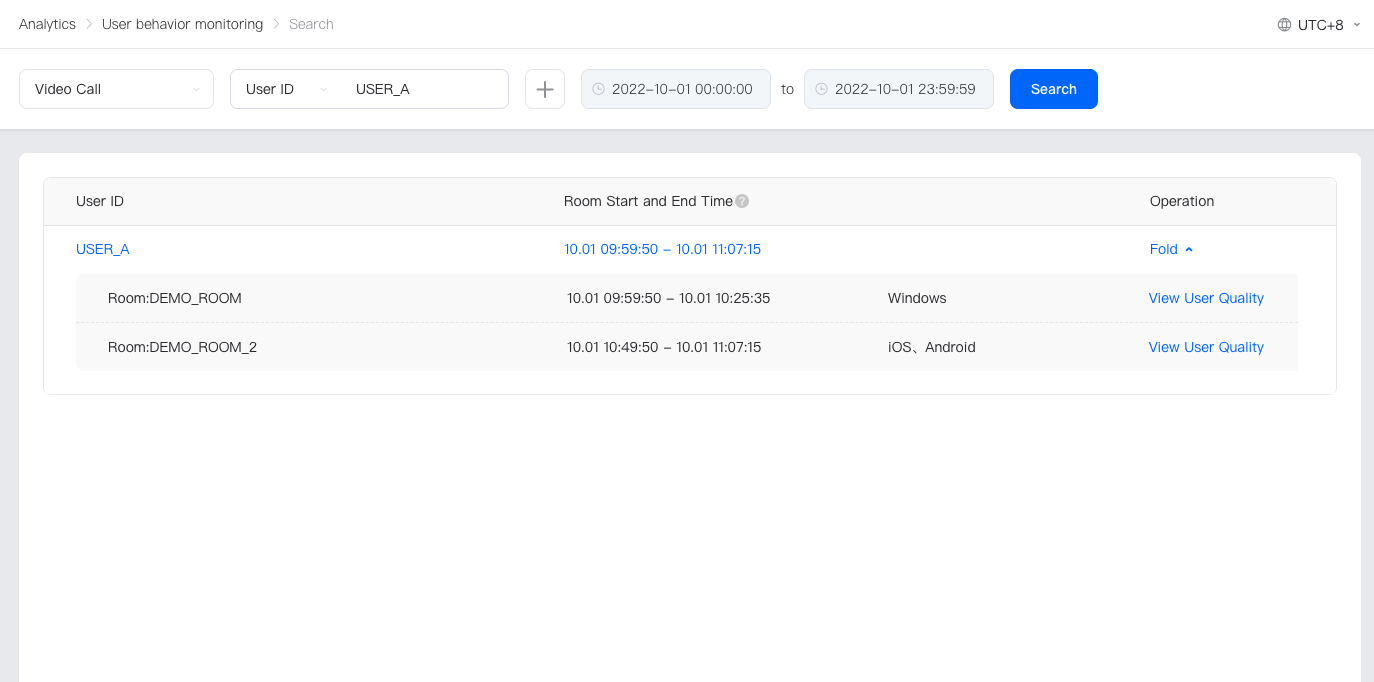
On the Search page, enter the user ID, adjust the time range, and click Search. You can obtain the list of all rooms to which a user has logged in during the specified period, view room IDs, start time and end time of rooms, and information about the platform used by the user during stream playing and publishing.
)
View all users in the lifecycle of a specified room.
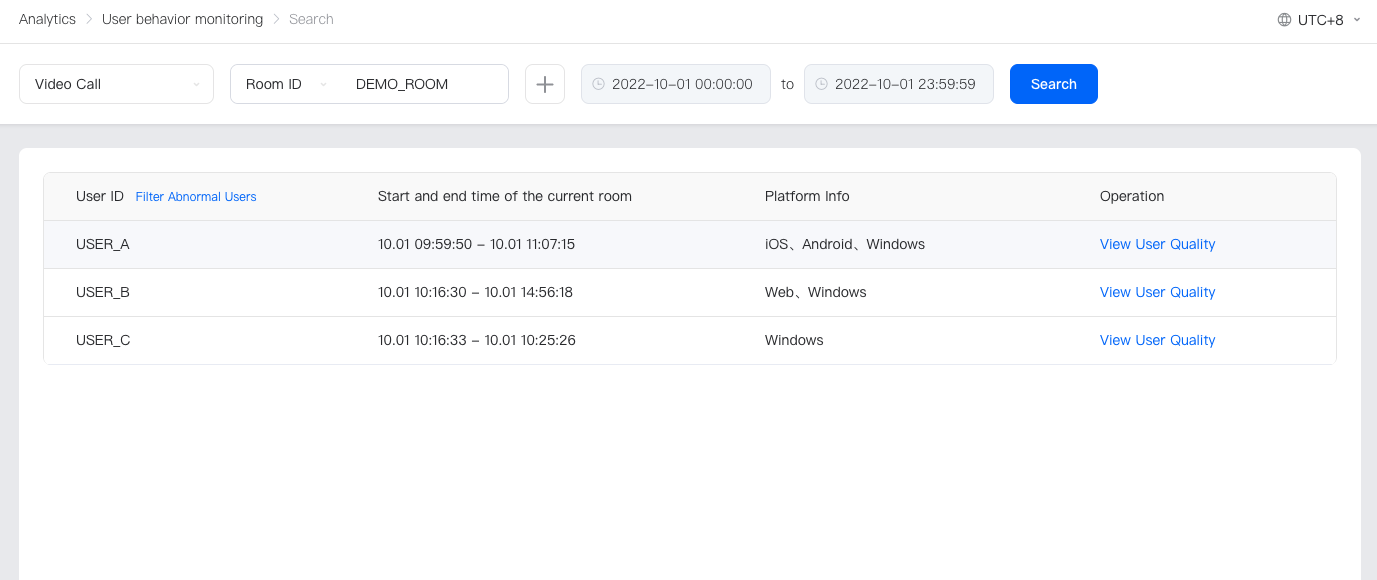
On the Search page, enter the room ID, adjust the time range, and click Search. You can view all login users in the lifecycle of the room, the time when each user logs in to and logs out of the room, and information about the platform used by the user during stream playing and publishing.
The Analytics Dashboard module proactively identifies users in abnormal states. You can click Filter Abnormal Users to obtain the list of users in abnormal states and click View User Quality to further view the problem information and root cause and solve the problem.
)
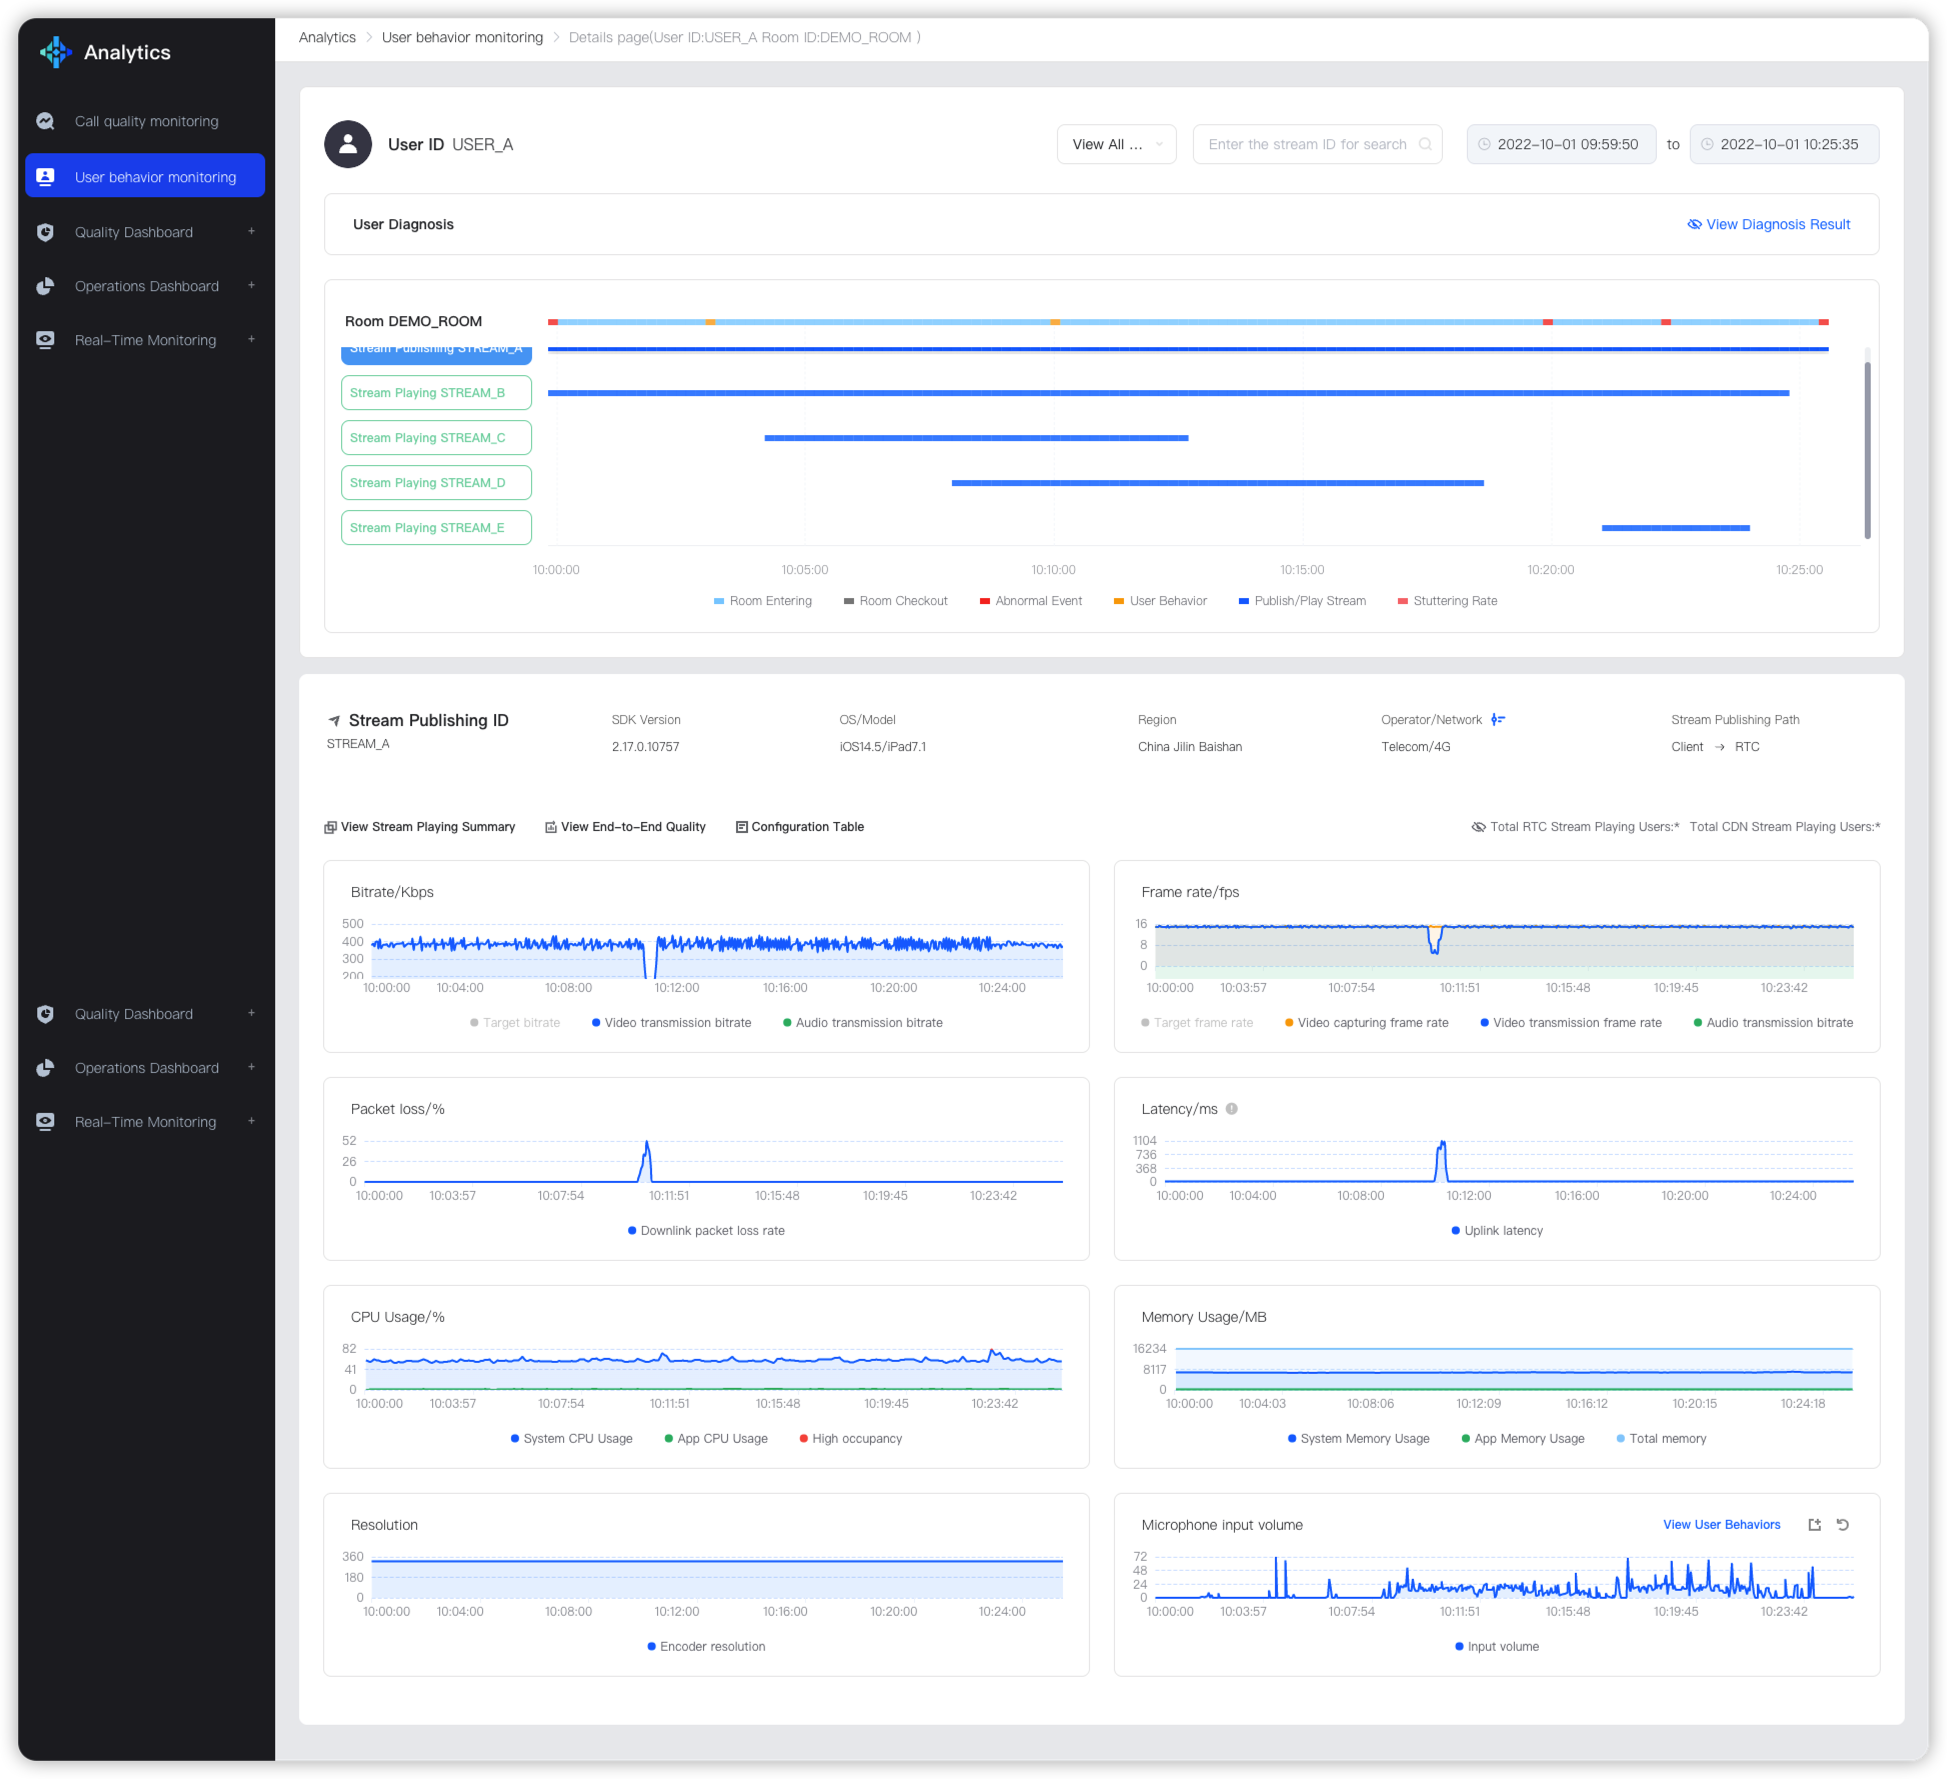)
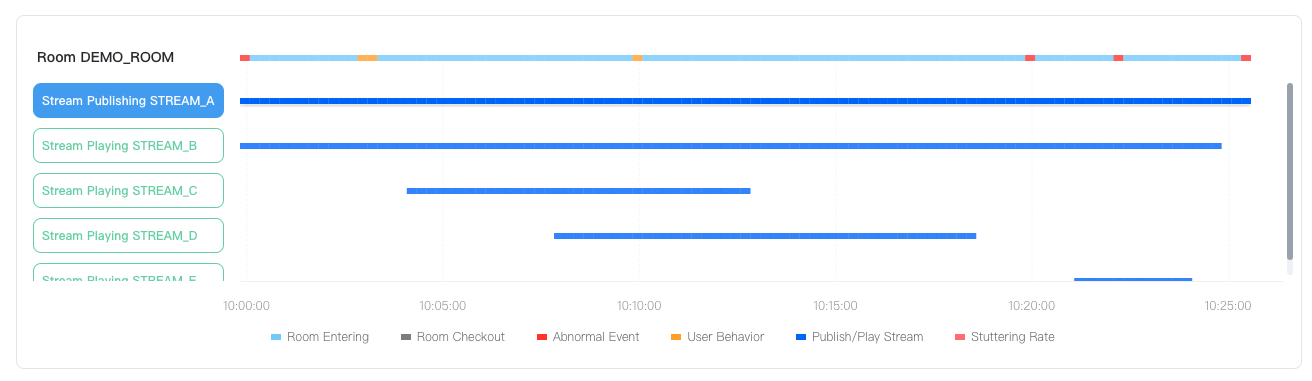
In the timeline area, the first line indicates the online status of a user in a room. It shows the online time (in blue) and offline time (in gray) of the user in the room, clearly and intuitively indicating whether the user has logged in to and out of the room multiple times. You can learn the continuous online status of the user from this line.
)
In the timeline area, lines (in deep blue) below the first line show all playing and publishing records (in ascending order of stream start time) of a user in the specified period. You can learn the start time and end time of each stream, the time length of stream playing and publishing, and whether the user has played or published a stream multiple times.
The Analytics Dashboard module marks the lag period (in pale red) during stream playing for you to rapidly locate streams that affect user experience. You can further view the stream quality data and identify the root cause of the problem.
)
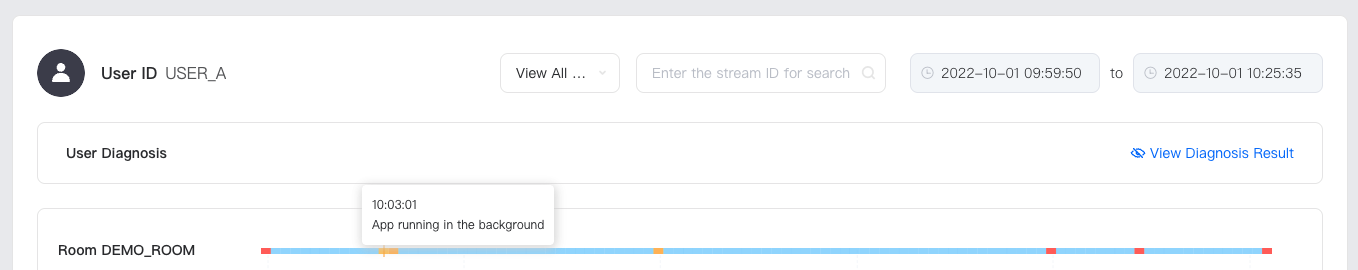)
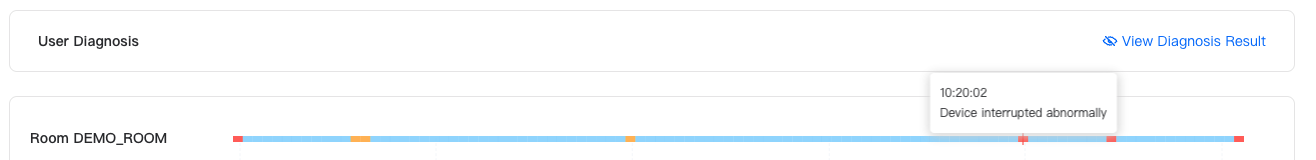
The first line in the timeline area also shows user behavior (in yellow) for you to learn the user's operations at different time points and determine whether the audio or video quality problem is related to user behavior. The following table lists some typical behavior events.
| Behavior Event | Description |
|---|---|
| Turning on/off the microphone | When the stream publisher turns on/off the microphone, stream players may be unable to hear the sound. |
| Turning on/off the camera | When the stream publisher turns on/off the camera, stream players may be unable to view the image. |
| Turning on/off the speaker | When a stream player turns on/off the speaker, he/she may be unable to hear the sound. |
| Switching the app to the frontend or backend | When a user switches the app to the frontend or backend, stream publishing or playing may be interrupted. |
| Changing the network type | When a user changes the network type, the network quality may be affected. |
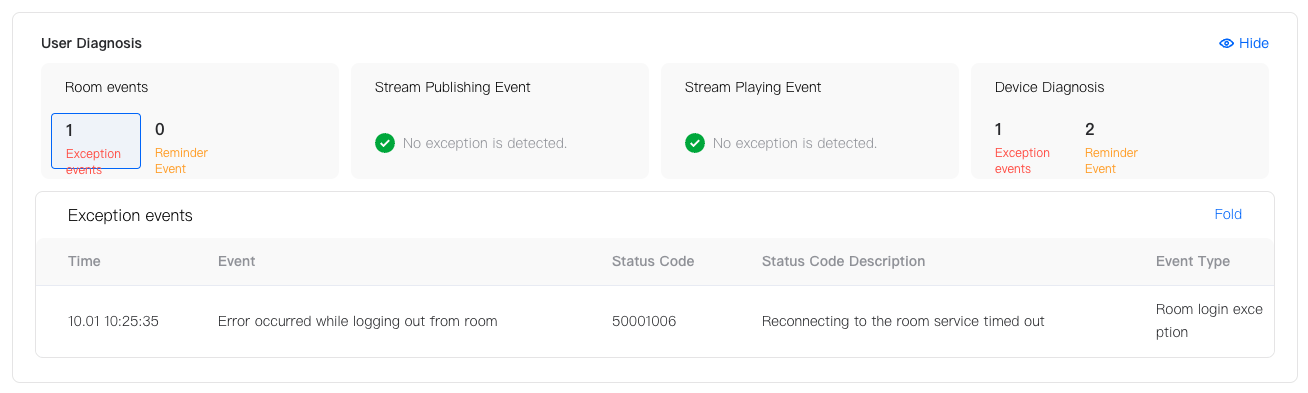
The Analytics Dashboard module proactively identifies abnormal events in the user lifecycle and divides the events into exceptions and reminders by severity. You can quickly diagnose exceptions, learn the exception details and causes, and solve exceptions.
You can use either of the following methods to view the abnormal events:
)
)
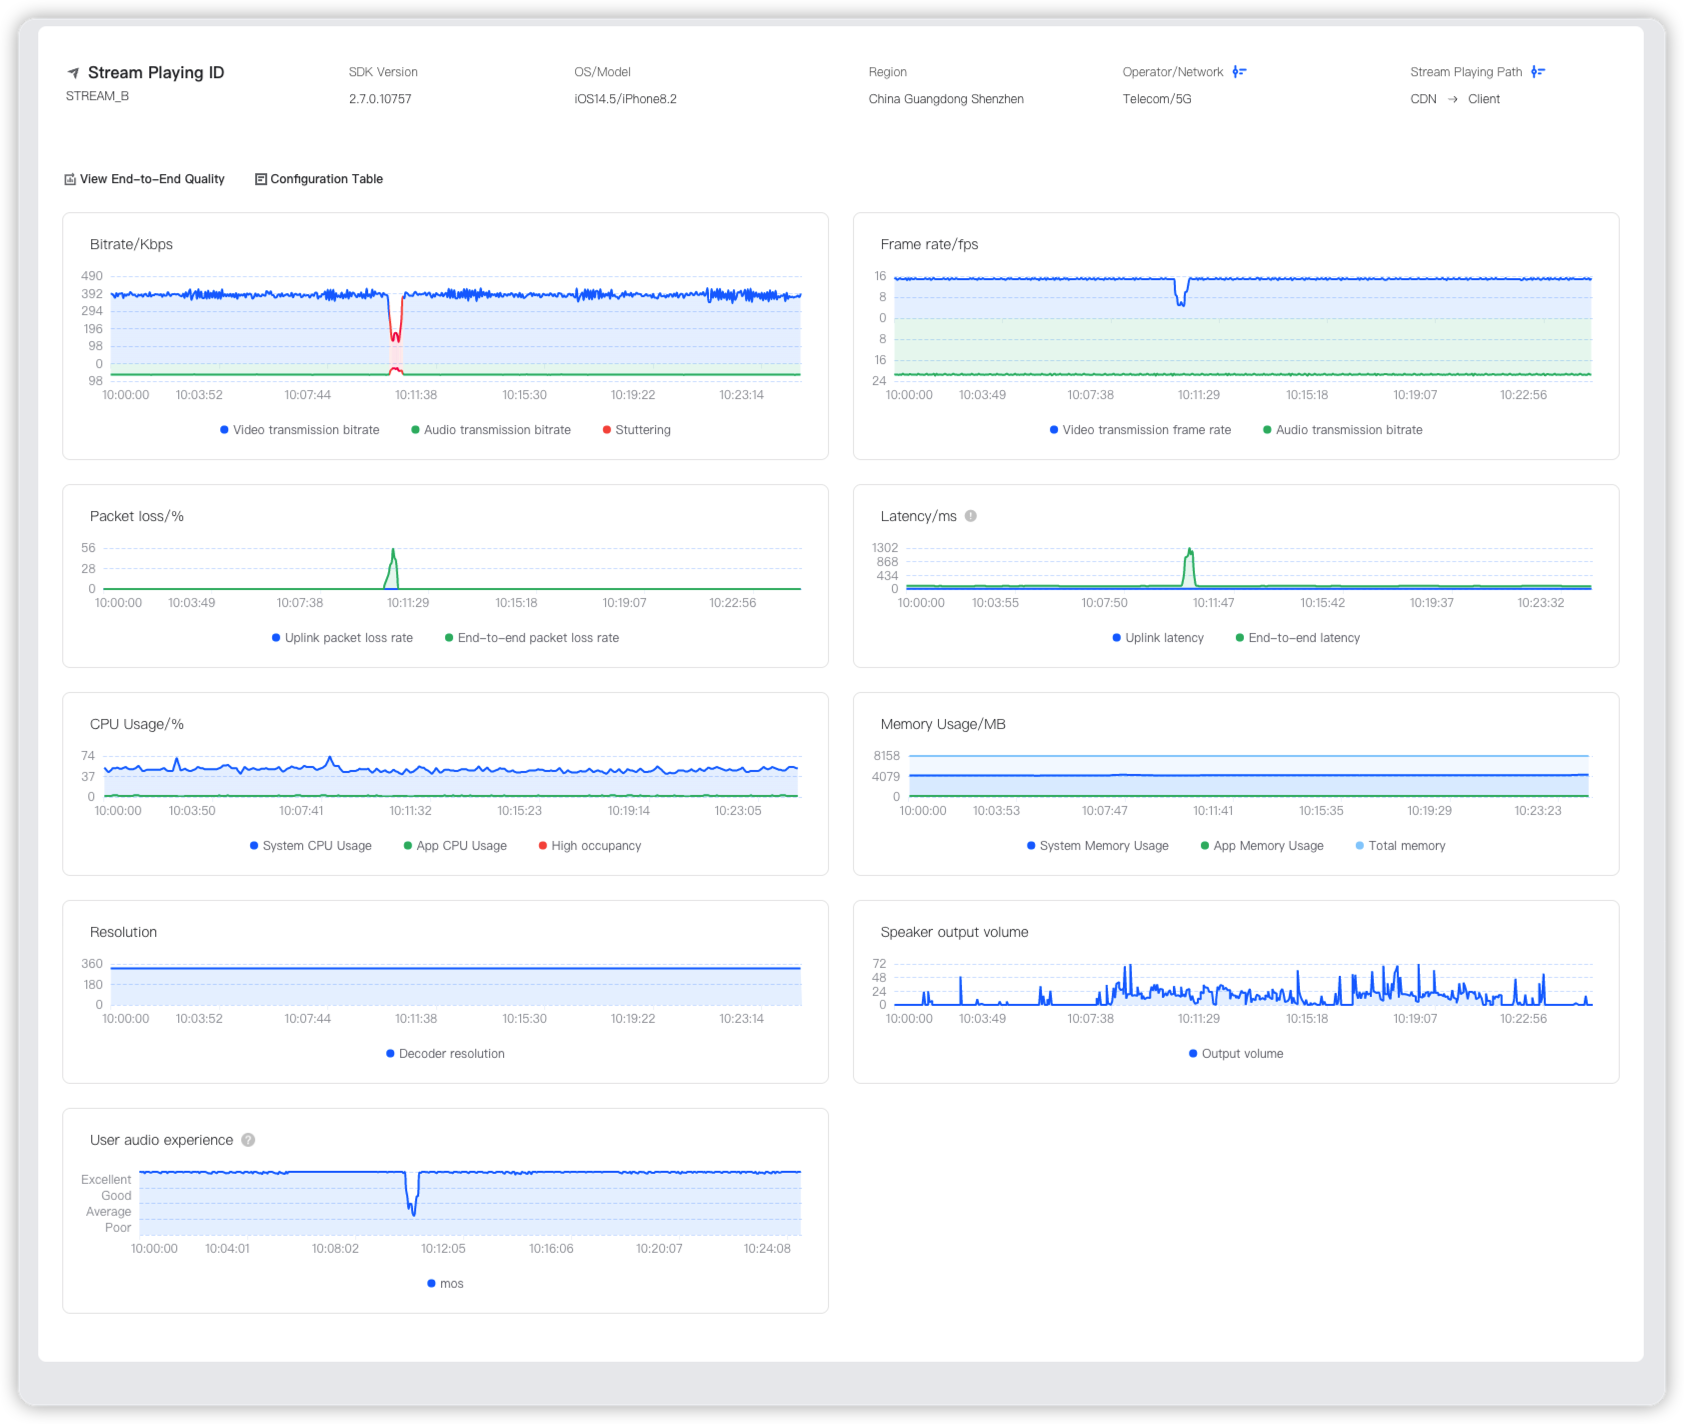
In the timeline area, click the line of the target stream. You can view the data of the following stream quality indicators in the area below:
To view details about each indicator, refer to Data explanation.
)
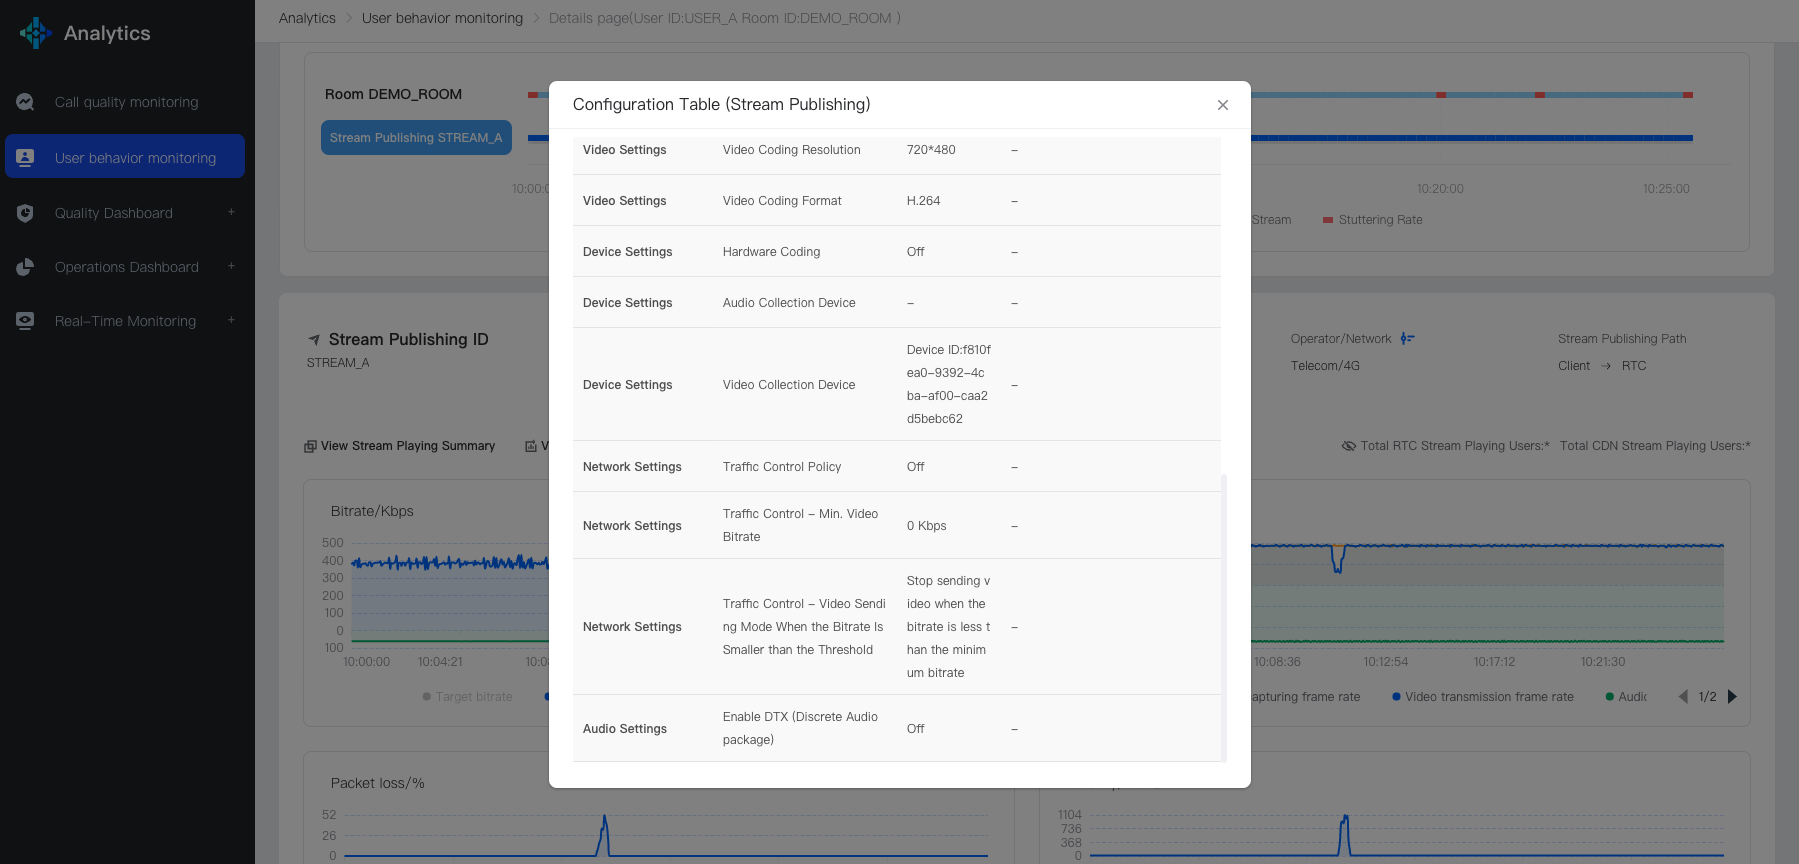
You can view the configuration of stream publishing and playing and check whether the configuration is proper and whether the values of the configuration items change during a call. In this way, you can determine whether the configuration causes the audio and video quality changes.
The configuration is displayed based on the stream publishing and playing interval. If a user publishes and plays streams multiple times, multiple records are displayed.
Currently, only the configurations on the Native and Web platforms can be viewed.
)
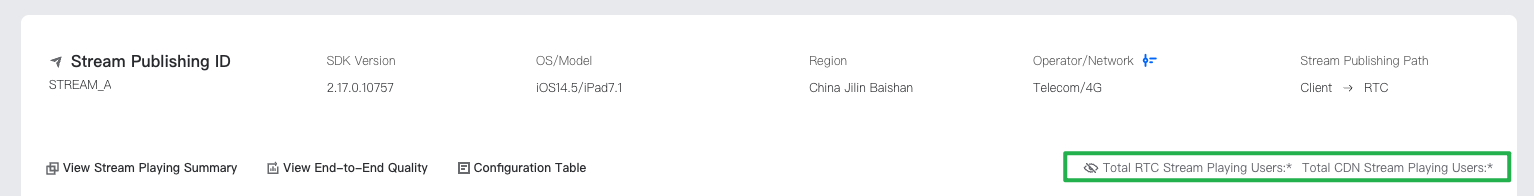
When viewing stream publishing quality data, you can view the accumulated number of users who play streams (from RTC or CDN) to evaluate the stream impact scale.
)
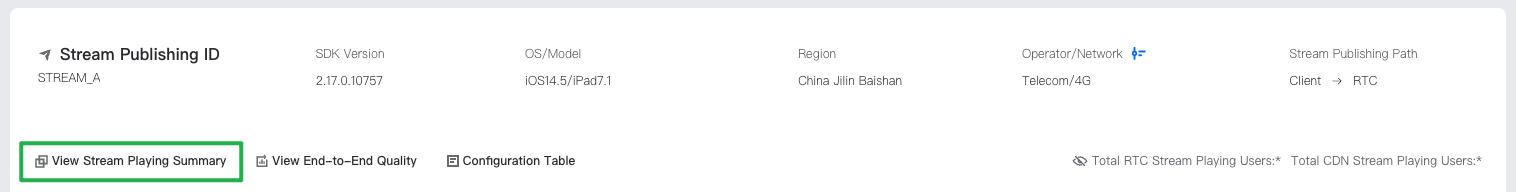
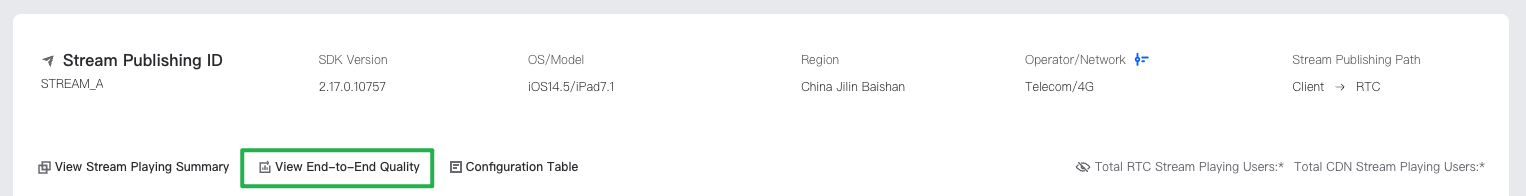
You can trace users who play the published streams and analyze the stream playing quality of the users. You can click View Stream Playing Summary and view related data on the stream publishing quality page. For details about the page, refer to Call quality monitoring.
)
You can view call interaction quality to learn details about interactions between the calling and called parties. You can click View End-to-end Quality and view related data on the end-to-end quality page. For details about the page, refer to Call quality monitoring.
)